The election countdown is on…How to prepare? What message can investors take away from markets in the run up? Join us live for todays Barometer Readings Webcast. 4pm EST today (Wednesday Oct 21) https://bit.ly/2Hue3Ny $SPY $QQQ $TLH #Equities


The election countdown is on…How to prepare? What message can investors take away from markets in the run up? Join us live for todays Barometer Readings Webcast. 4pm EST today (Wednesday Oct 21) https://bit.ly/2Hue3Ny $SPY $QQQ $TLH #Equities
So many things to worry about for investors! Join David Burrows, Chief Strategist and a special guest for our weekly webcast. We will update current thinking / positioning and discuss potential market impact of the upcoming Presidential election. #equities $SPY $QQQ $IWM

Watch our most recent Barometer Readings Video where we discuss our current market outlook and favoured sectors.
Much has been made of the late January equity swoon and whether the bounce from the Feb 9 lows is sustainable.

From the rising 200day moving average and the overnight S&P500 futures lows from the previous Monday night equities have rallied sharply.
Since then, almost immediately, the four key short term breadth indicators Barometer uses reversed up after the sharp declines that began as extremely overbought and finished as oversold. These include % of NYSE stocks trading above their 50 day moving Averages, % of NYSE stocks trading above their 150 day moving averages, % of NYSE equities with positive weekly price momentum and % of NYSE Equities hitting new highs vs. new lows. Barometer removed the futures hedges put in place January 30th on Feb 9th.


Almost immediately following the short term indicators positive reversal (improving breadth) our key long term indicator reversed back up signalling a continuation in expanding market breadth and allowing the Barometer Team to redeploy accumulated cash in various portfolios.
NYSE Bullish %

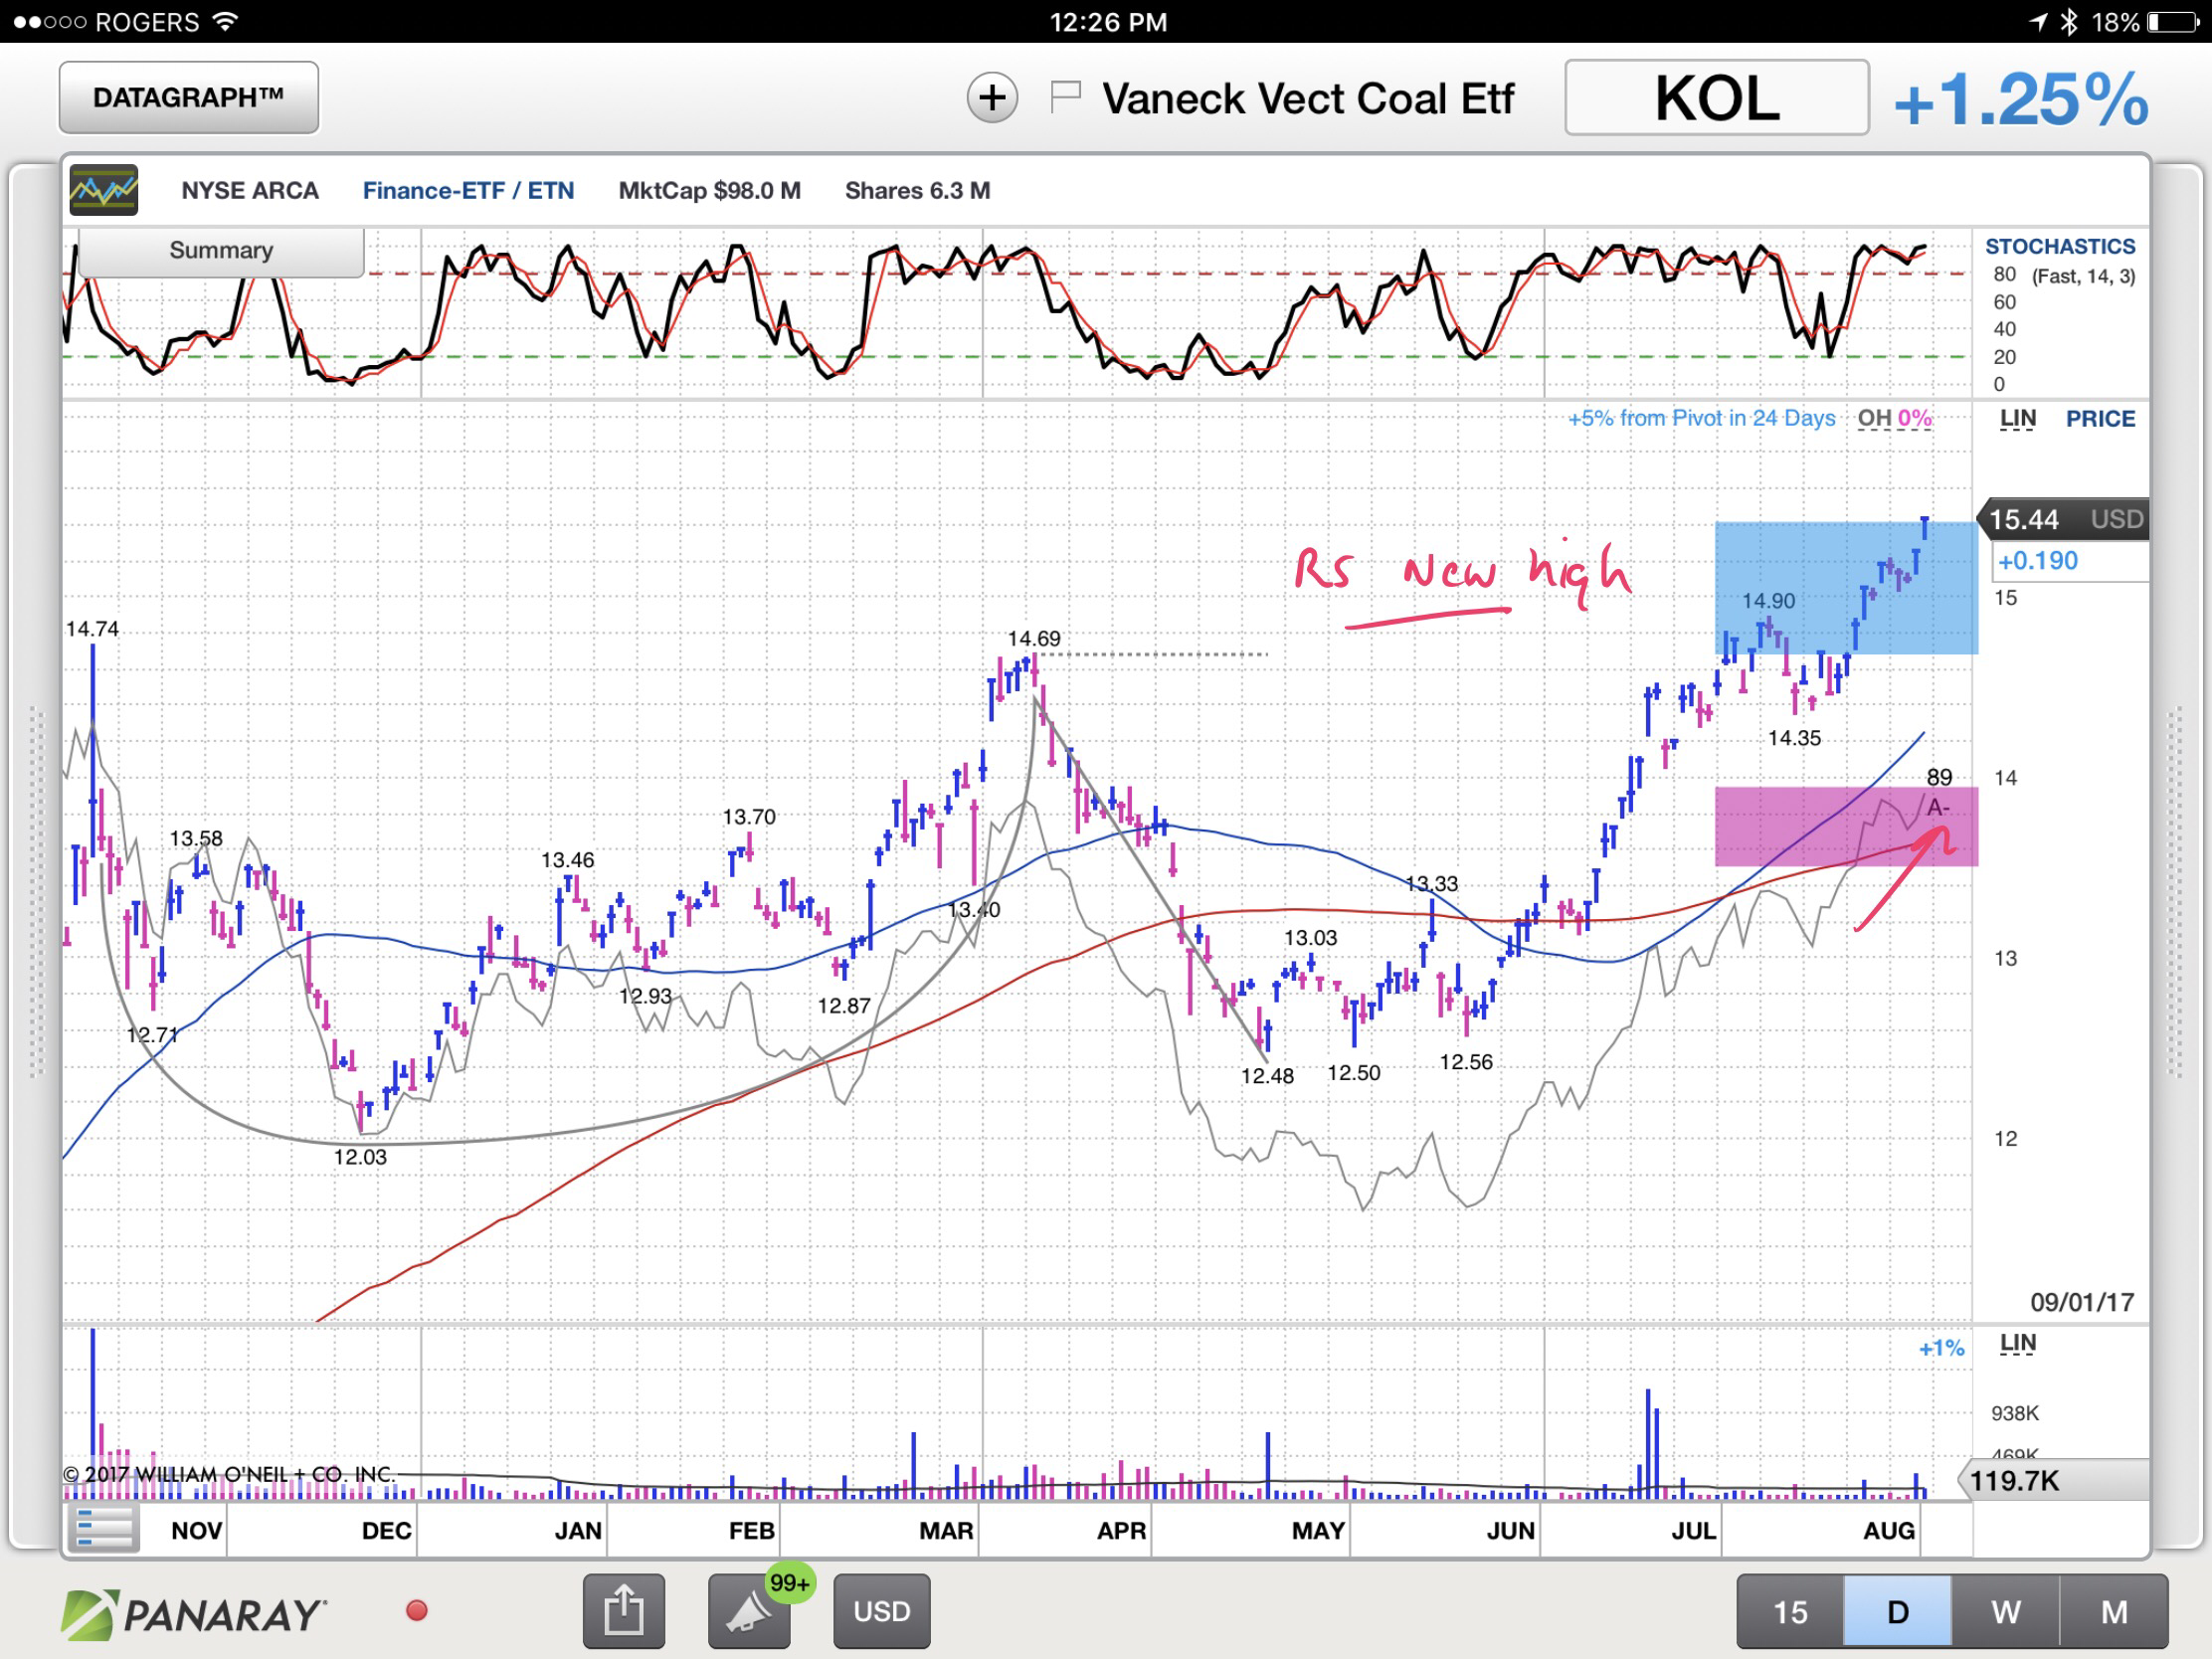
As we sit today, it is important to note that the very clear leadership that had been leading the market coming into the correction is leading the rally coming out. In a structural bull market leadership should be clear and persistent. This can be frustrating for those trying to buy “broken getting fixed” or laggards as opposed to “good getting better”…leadership. New relative strength highs before the correction in the strongest momentum stocks have resolved to higher relative highs post the correction


The message….Stick with established leadership until clear signs of change!
The common characteristic in today’s market is Reflation. The market’s signalling is that we have moved from disinflation to reflation and lessons learned during 35 years of falling rates all have to be questioned….A Costanza moment!
This could last a while.
https://media.giphy.com/media/1VDOxgkEpkUSs/giphy.gif
The combination of targeted focus on clear leadership, hedging and timely redeployment have been a significant contributor to a strong start to 2018 from a risk adjusted returns standpoint.

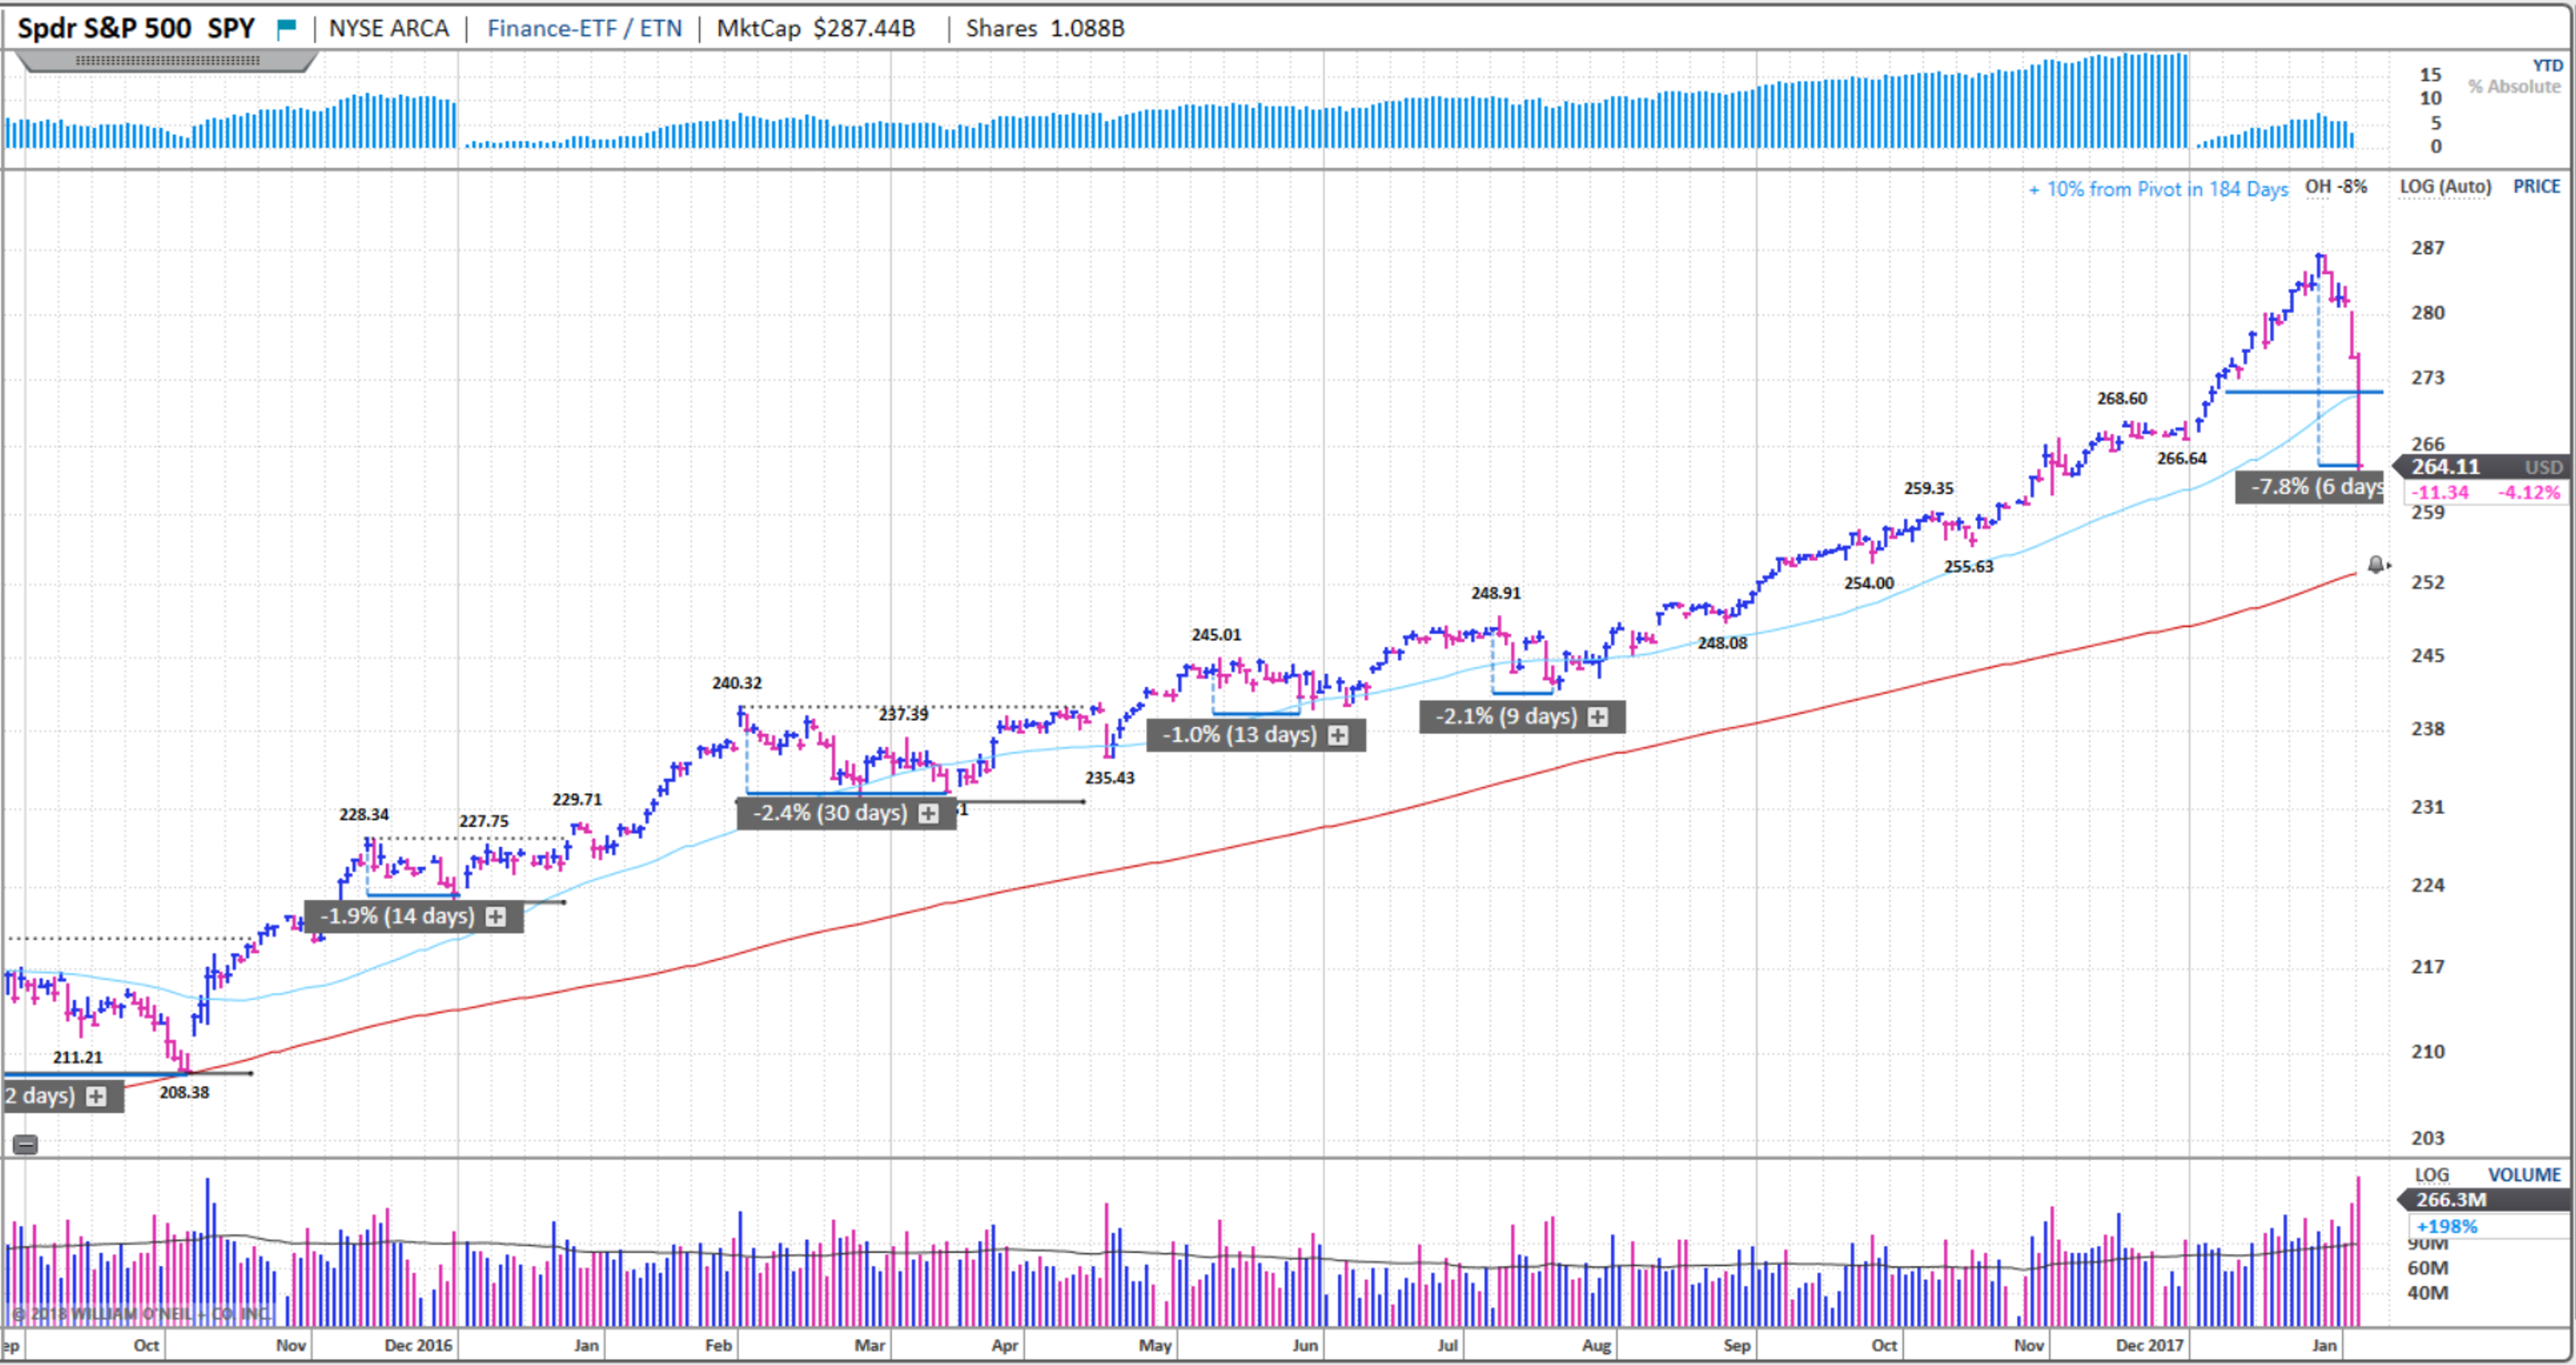
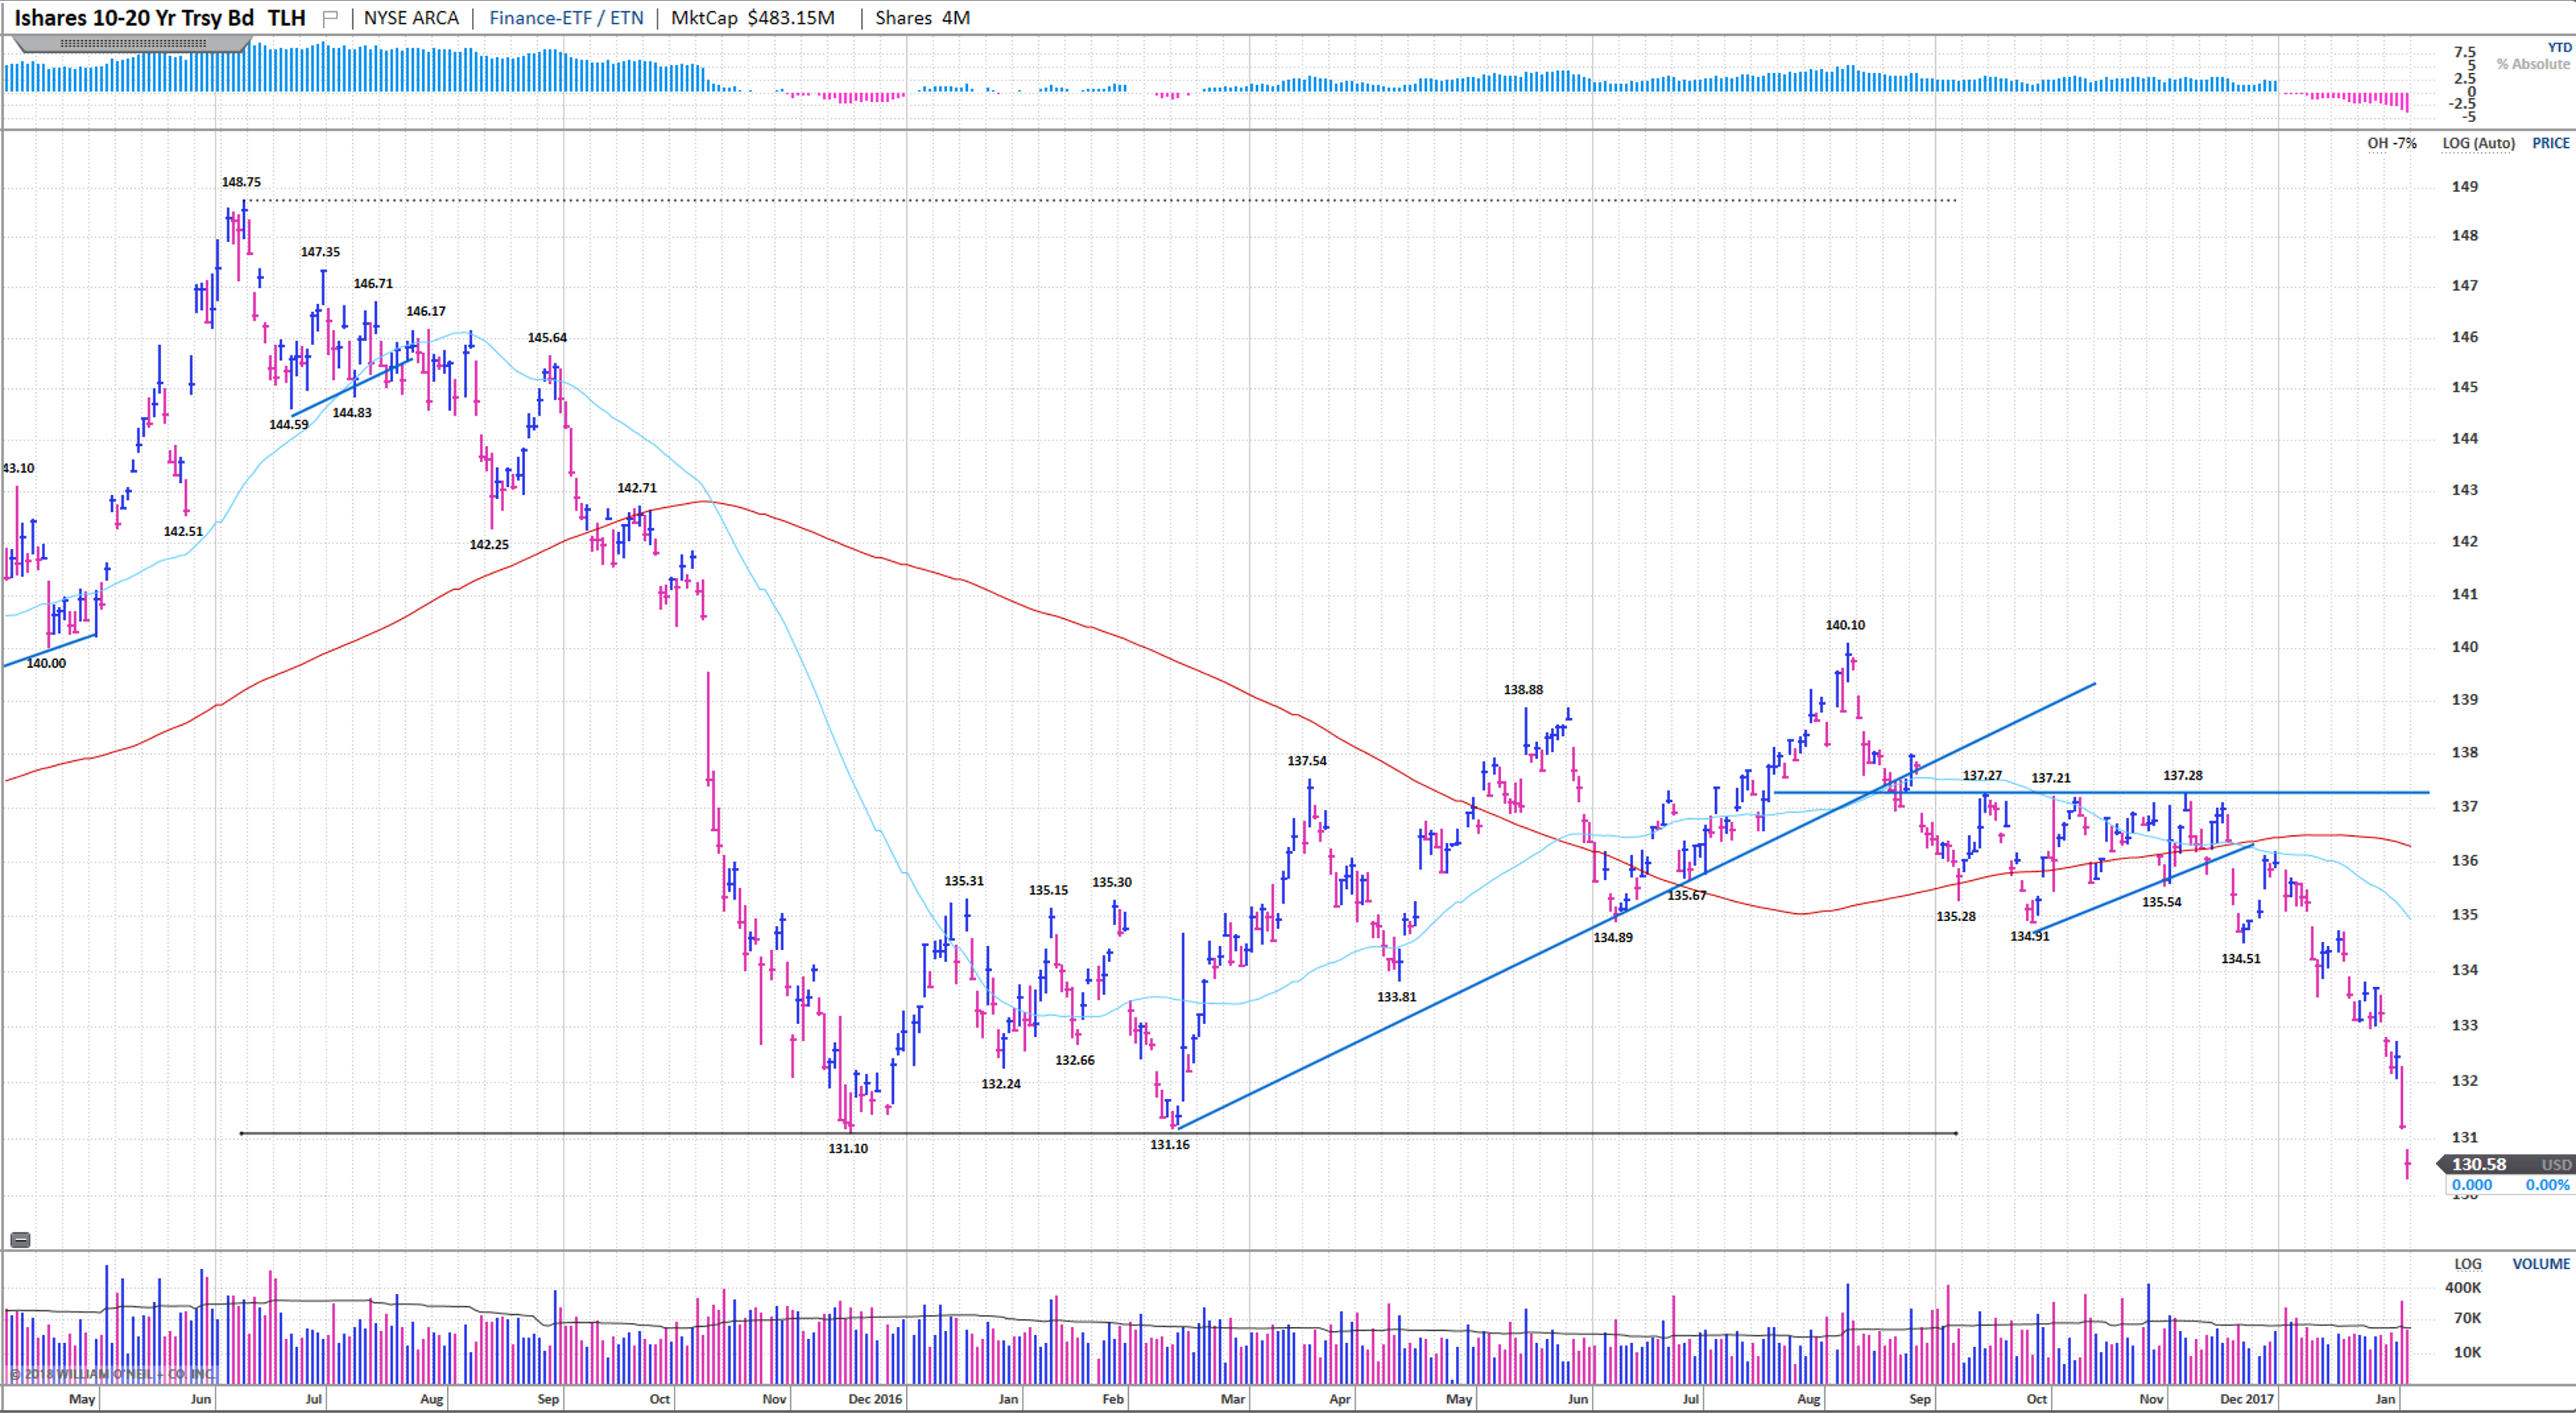 As of the close yesterday, the S&P500 has pulled back 7.8% from highs reached one week ago. Internally at Barometer the week before last we were discussing the extent that the market had become extended above its longer term moving averages and the possibility that we could see correction. As a potential trigger, we noted that the price of a Long Term US Treasury Bond had started to decline more rapidly due to strong economic and potentially inflationary data. Monday of last week, four of our short term indicators flipped lower signalling short term caution.
Last Tuesday morning the Barometer team executed S&P500 futures hedges covering approximately 50% of the portfolio equity exposures across the Barometer Private Pools and Funds in order to mute volatility. While it is never enough, these hedges have had a significant positive impact on portfolios this past week and allowed us to get to this today without having to sell winning positions which would trigger taxable gains.
Yesterdays market close, and the open today are being driven by technical factors that should clear over the next day or two. Bull markets are punctuated with short sharp pullback that shake out the latecomers. As most know, our view has been that we are in the midst of a secular (long term) re-valuation of developed market equities. It would be extremely rare for a bull market to come to an end from a Friday to a Monday morning with out any prior deterioration in our long term models. We believe that this volatility will clear.
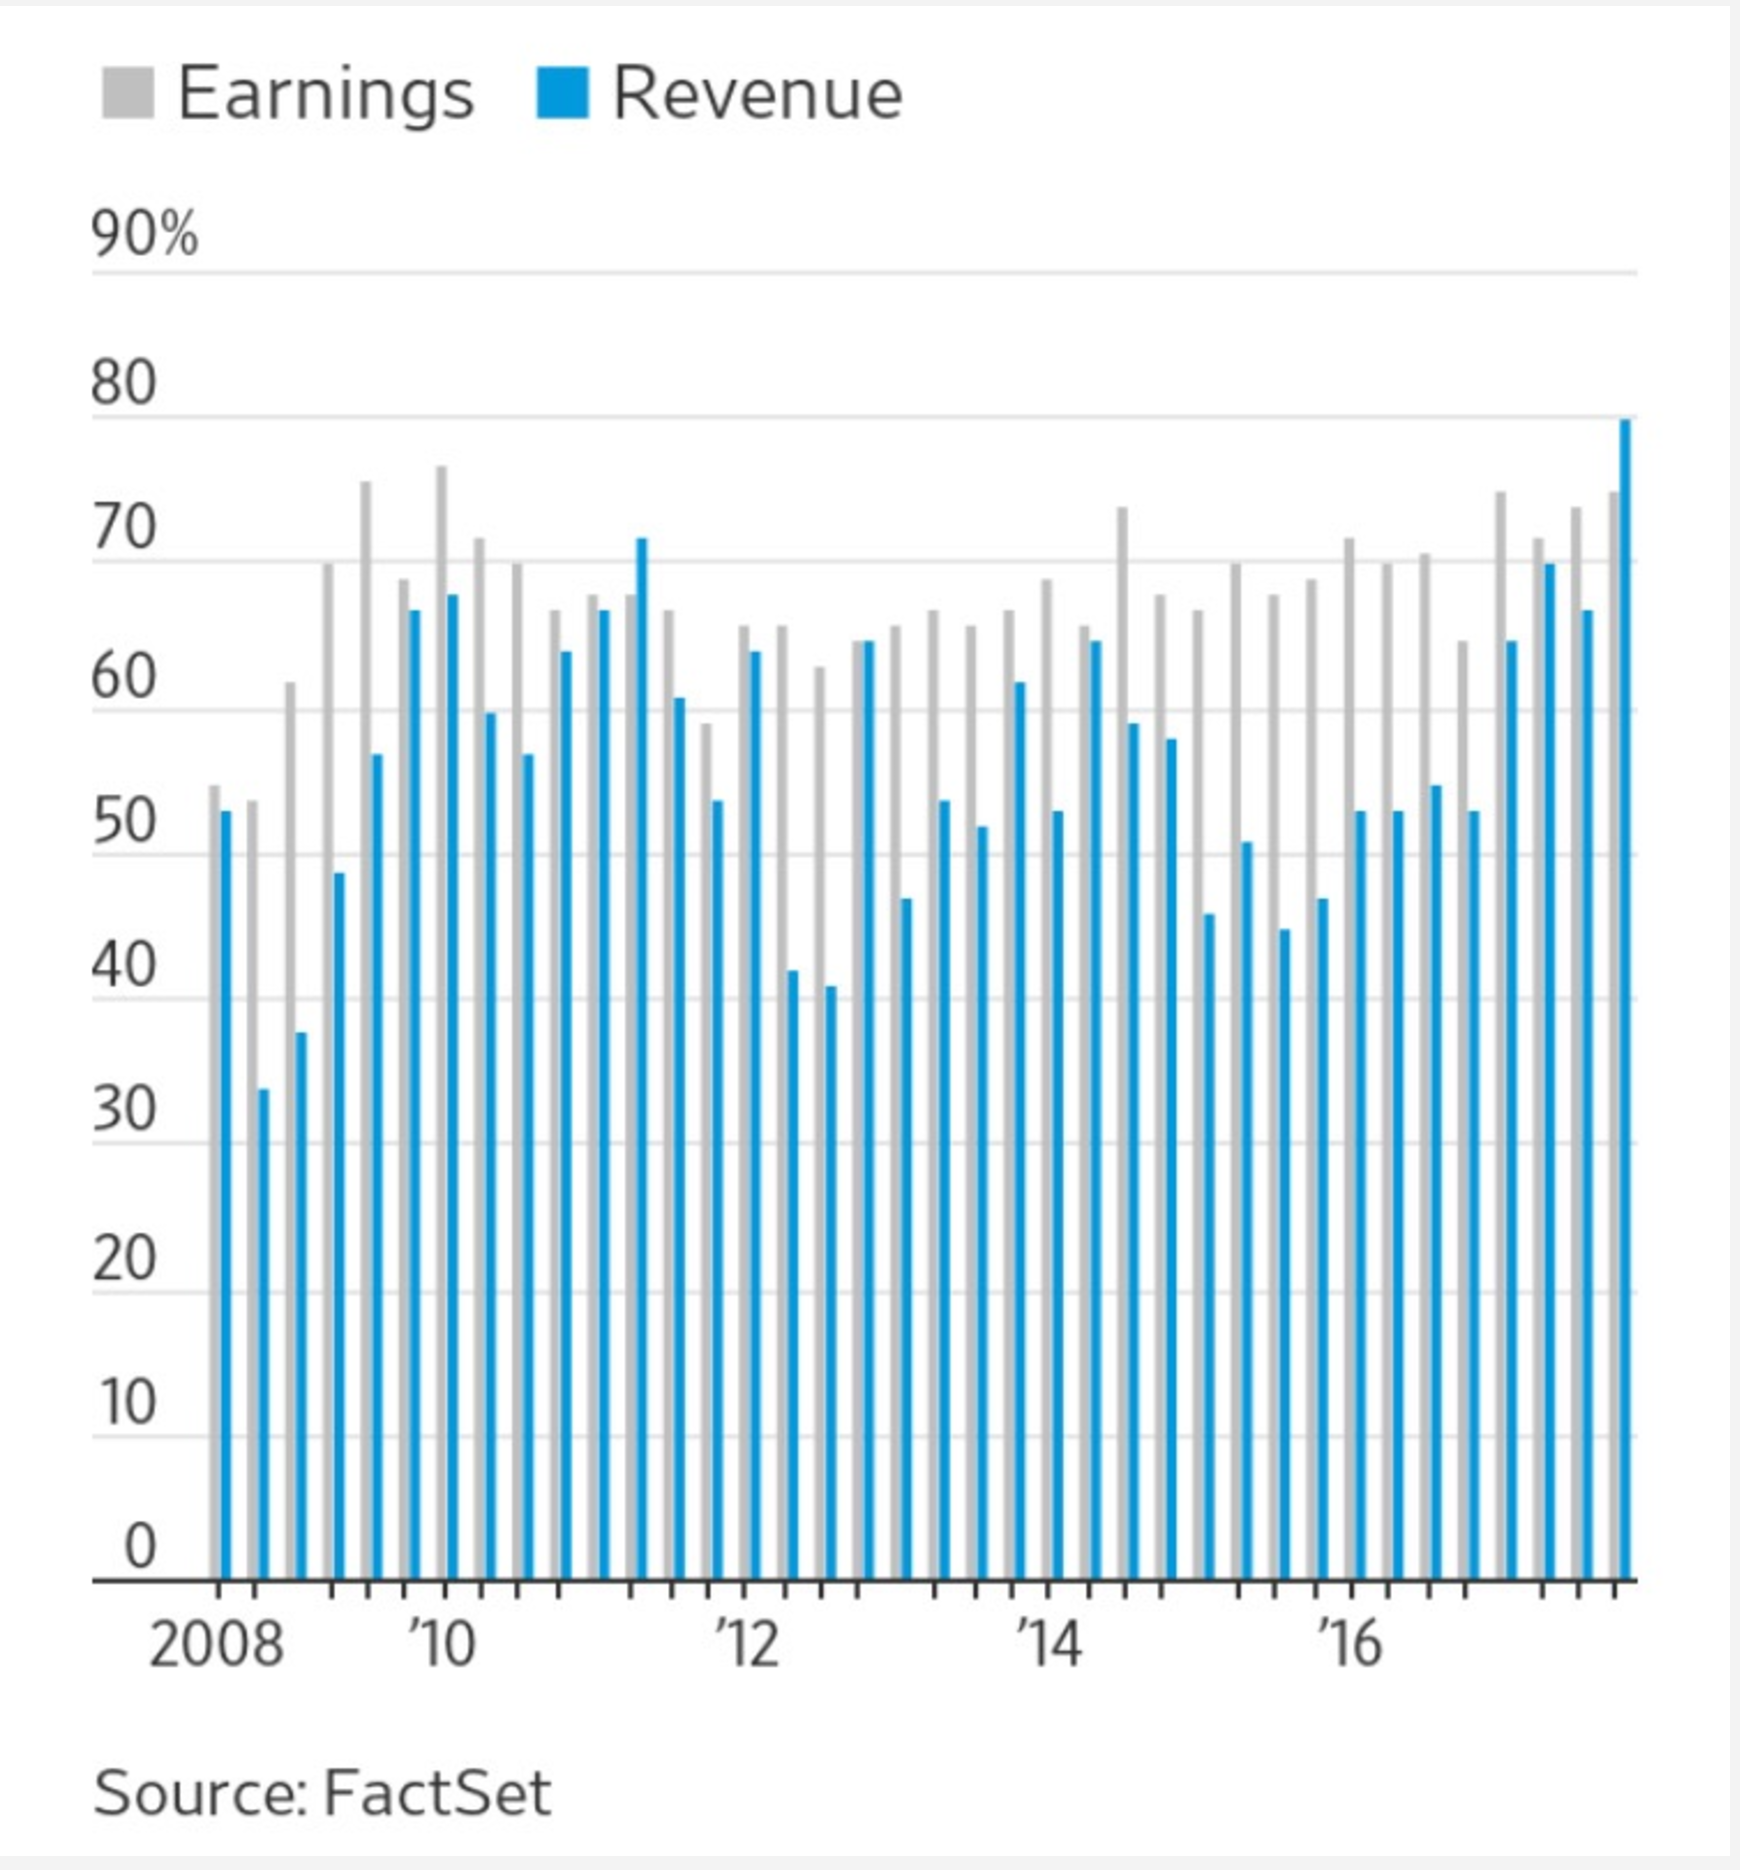
Fundamentally, conditions remain positive. The earnings period we have just come through reflected the best quarter of earnings and revenue beats since 2008. The month of January saw the greatest number of upwards analyst earnings revisions since 2002. The employment picture continues strong and credit conditions show no signs of stress.
We expect that the near term weakness and volatility is likely to clear over the next few days and potentially as soon as today or tomorrow and then markets are likely to resume an upward trajectory. We will update as markets unfold.
Early in February 2016, the research that Barometer conducts — tracking the progression of equity market breadth — gave an important BUY signal for U.S. Equities. Two years of low volatility and consistent, constructive trending markets and economic conditions have dealt us a rally for the ages. Where do we go from here?
Looking at cues we get from the current model set-up and historical perspective divulges some compelling clues as to what may be in store for us as we enter 2018; not only for U.S. Equities, but for other major developed markets, U.S. Bonds and Basic Materials.
Please watch our short Barometer Readings Webcast to hear what our work suggests may be coming next.
Japanese Equities look ready to extend rally on the back of strong earnings beats and improving technicals. Relative strength vs. US equities has been rising even on a currency hedged basis and are a significant holding and compliment to India, Taiwan, China and Latin America in Barometer’s Global Macro Pool.


The last week of August was the most encouraging of the month. After a strong start to the year, and a positive July, as previously noted it tends to be that the seasonally weak months often wind up better than average.
Early in August, short term breadth indicators weakened raising the risk of correction. However, after only a shallow pullback and a big reversal day Monday, all of our short term equity breadth indicators flipped back positive to end the week. This raises the spectre of continuation of the longer term secular bull trend and sets up potential for a Q4 chase by those underinvested.
The first of the major improvements this week was the reversal up in the Nasdaq 100 bullish % (percent of stocks in point and figure up trends).

Over the next three days we got positive reversals in short term New York breadth indicators …% above the 50 day moving average, % above the 150 day moving average, % of stocks with positive weekly momentum and finally % of stock hitting new highs vs. Those hitting new lows.


The S&P 500 has broken a double top and Nasdaq 100 has made a new all time high.

Leadership can found in Tech, Defence, Biotech, Materials, China and Lat Am.


The biggest challenge for us as Canadian investors has been the weak performance of our local market and the sharp rally in Canadian dollars vs. USD or rather the very weak USD vs. almost all currencies. While it is unlikely that the Canadian residential real estate market and the very strong new auto sales figures will remain as strong in the second half as the first, the likelihood of a near term rate hike is creating lift in the currency and raises the need to hedge back at least some exposure to CAD depending on the mandate.


It is often said that it is not the news that matters but rather the way the market reacts to the news. Following a sloppy few weeks and deterioration in both our short and long term indicators, it appears that once again this pullback will be more shallow than many expected (including us). However, given […]
It is often said that it is not the news that matters but rather the way the market reacts to the news.
Following a sloppy few weeks and deterioration in both our short and long term indicators, it appears that once again this pullback will be more shallow than many expected (including us). However, given the reversal from a retest of lows yesterday, and the follow through day we are seeing today, it appears that Nasdaq 100 bullish percent will turn back positive by day end along with most of our short and intermediate term indicators.
Nasdaq 100 Bullish % (equal weight % of stocks in long term up trends)

Nasdaq 100 (QQQ) Bull flag reversal
Following the overnight sell off Monday PM / Tuesday AM, US equities rallied through the day to show just how resilient the current market is. The US dollar tested new lows vs. Euro and also reversed ending positive for the day.
True leadership shows it’s face by being the first group to regain its footing after a sell off. The follow through rally today taking us above the recent range is a solid tell that the bull market is resuming in part lead by Semis, Software, Cloud and most important AAPL.


